vSAN Support Insight was introduced last year with the release of vSAN 6.6.1 ( VC/ESXi 6.5 U1 Patch 02 and above) . It is a phone home system leveraging the existing vCenter Customer Experience Improvement Program (CEIP). Health, performance, and configuration information for VMware Support and engineering. Once enabled and verified, log information is pushed back to VMware’s Analytics Cloud on a regular cadence approximately every hour . No actual customer data is phoned home and user enter able or identifiable data (Hostnames, VM names, subnets, IP addresses, Mac addresses) are obfuscated . In this blog you will further see what data is seen by VMware support vs your Webclient View .
How does vSAN Support Insight help Customers?
- Resolve your support ticket much faster by avoiding wastage of time by collecting multiple logs and uploading it to the support ticket .
- Help vSAN Engineering team analyze pattern of issues seen with different customers, helps them towards product hardening and development in future release .
- vSAN TSEs can view your environment with the data collected from VAC (VMware’s Analytics Cloud ) in obfuscated manner , provide recommendation/ action plan without a need of a remote session/webex to your actual environment and if you were entitled for a Premium Support Agreement , you receive Proactive Support from a TSE based on issues seen from VAC .For more FAQs , please visit : vSAN-SUPPORT-inisight-FAQ
To Enable CEIP program for vSAN Support insight , follow the steps available HERE
What Telemetry Data is being sent to VMware?
Security teams will be really concerned about the data which is being relayed to VMware via CEIP , well you call definitely see what data is being sent to VAC from your vcenter server . In my current test setup I have a VCSA .
- SSH into VCSA
- From the vSphere-Webclient (Flash based) , find out your cluster UUID , by going to Cluster ⇒ Configure ⇒ “Health and Performance” , under “Online Health Check” , you have “Support Tag” , where you will have two UUIDs sperated by colon “:” , example (918c59e1-7456-45e9-9575-9e18d074f480:523d5e56-05a4-d751-0c33-04ae7a42599b) , the first UUID is your Vcenter server UUID and the second UUID is your Cluster UUID .

- Run command: cd /var/log/vmware/vsan-health/ ,
- Data collected by online health checks is written and gzipped to files ” cloud_health_check_data.json.gz” and ” vsan_perf_data.json.gz , seen below example for the UUID which we had made a note earlier for vcenter and cluster .
 As we can see the JSON files are generated for vcenter as a whole and also for individual cluster within the vcenter server .
 - You can extract the json content by calling ” gunzip -k ” or view the contents by calling ” zcat “
Note that you need an “obfuscation map” (aka key) to make sense out of the data in terms of host-names / VM names / ip-addresses etc. Without that you can stare at the dataset all you want, but you won’t be able to relate it back to a customer. I would also add that we are not storing any VM/Workload data, it is configuration data / feature usage / performance data.All private data is obfuscated ,you can find the obfuscated data mappings in files <uuid>_obfuscationTableForHuman.json.gz
What You See ?
Lets use the same example for a vcenter server whos UUID is “918c59e1-7456-45e9-9575-9e18d074f480” and a Three node All-Flash which is my test environment who’s UUID is “523d5e56-05a4-d751-0c33-04ae7a42599b” .
Lets now assume that I am filing a support ticket with VMware for an issue/warning for this particular cluster . I have already signed up for VMware-CEIP and CEIP configured properly , this can be verified on the webeclient under vSAN health plugin .
From the Above screenshot we can see that this is a a three node vSAN cluster and we have some warnings against vSAN Build Recommendation and some online health check . Now that I have filed a support request with the vSAN-Technical support , I will additionally share the vcenter UUID (Cluster ⇒ Configure ⇒ “Health and Performance” ⇒ “Online Health Check” ⇒ “Support Tag” ) along with my problem description .
Now lets see what support team sees from their perspective . They simply enter the UUID of the vCenter server and Cluster UUID where the problem was reported and they will see a different view similar to vcenter , however no IP address or Virtual machine information , here are some screenshots for the same cluster and the data a TSE can view from their perspective .
What Support See ?
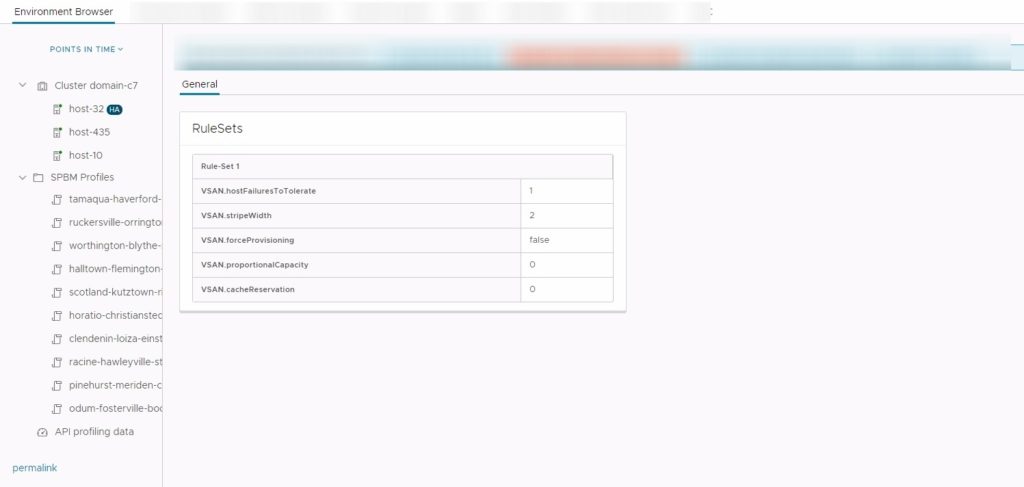
The General view contains details about the vcenter /ESXi versions and full specs of the server and vSAN configuration , it also contains limited vSAN cluster performance graphs and alarms seen on the cluster. It also has the list of storage profiles which were created for use with vSAN .
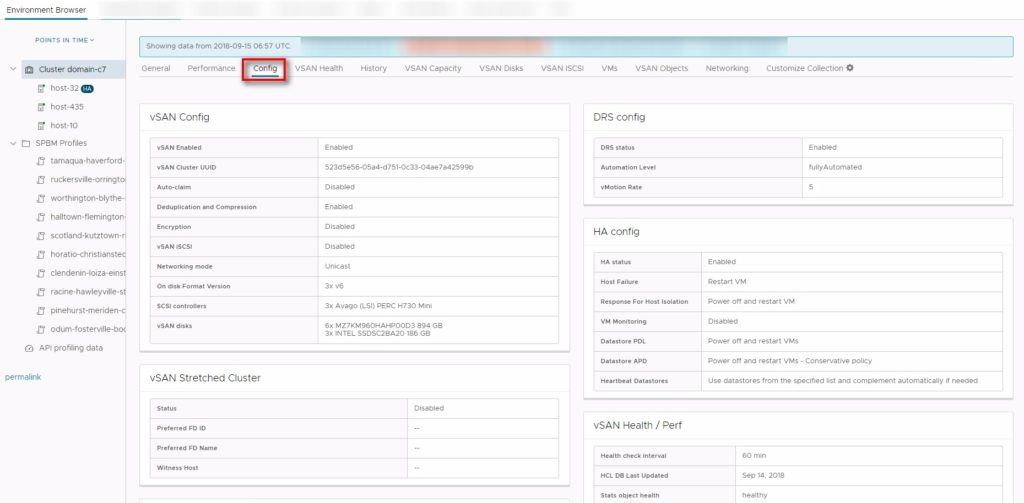
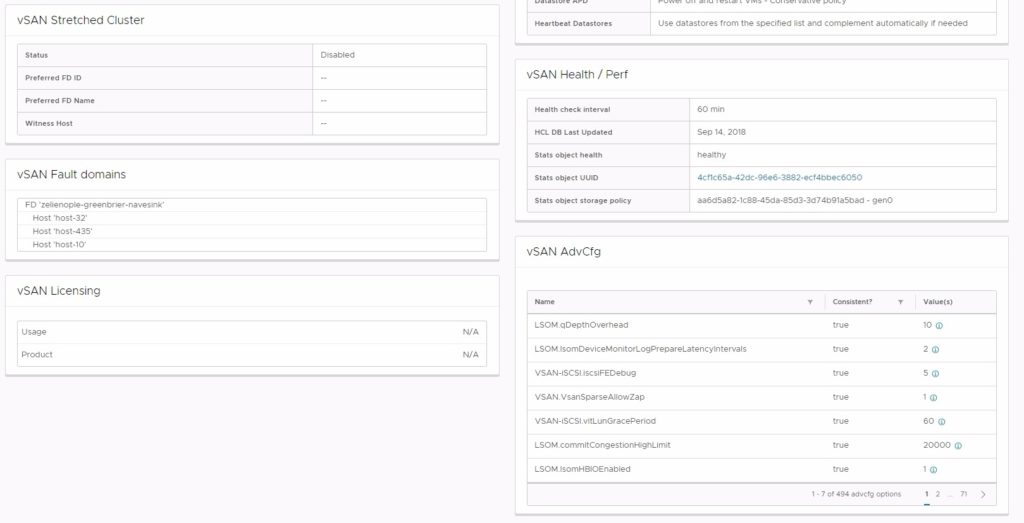
Config View shows all the features enabled on the cluster which includes vSAN-config , DRS , HA , Stretched cluster state , vSAN health and performance , number of fault domains , vSAN advanced parameter value sync between all hosts .
The vSAN-Health is exact set of data polled from the vSAN health plugin on the webclient , just that the data available on the VAC would be older than an hour from what we see on webclient . If we closely notice the health plugin is reporting the exact same warning what we saw earlier on the webclient .
The json export also contains the Disk group configuration and other information like the drive type,model and capacity information
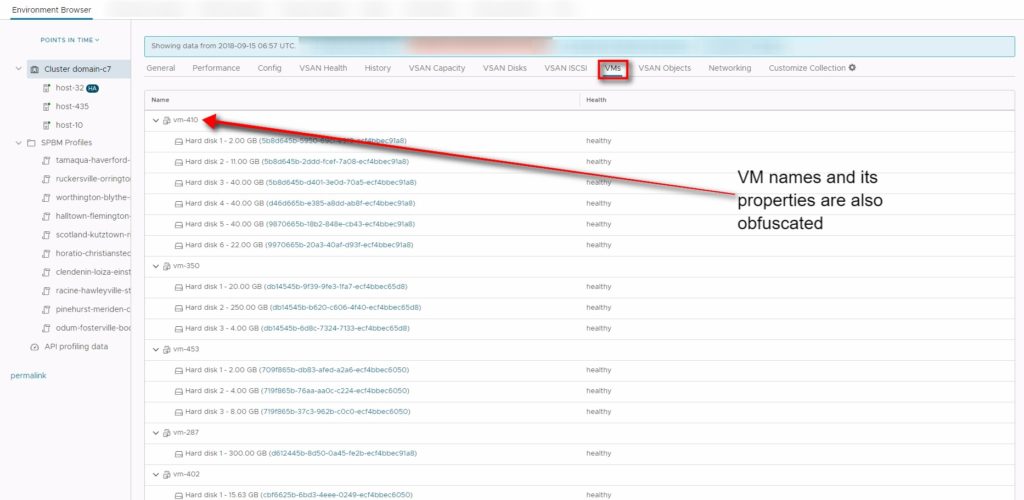
The VM tab contains list of VMs and their head disk healthy summary , here as well we see all data is obfuscated .
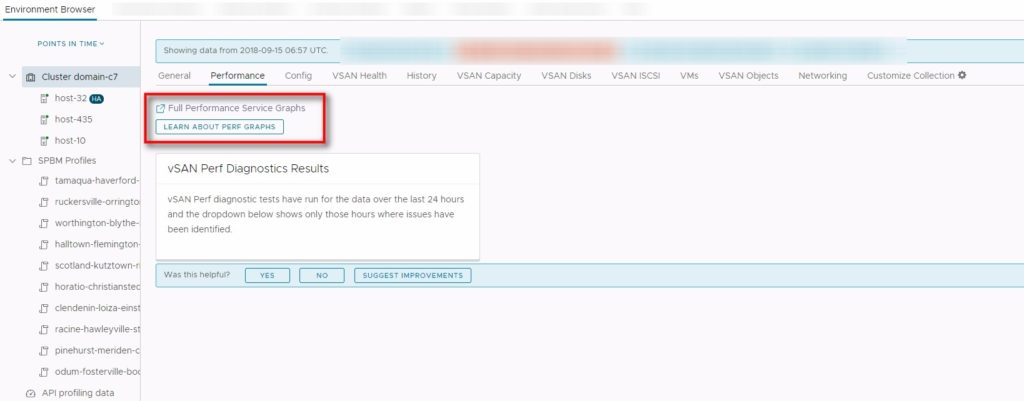
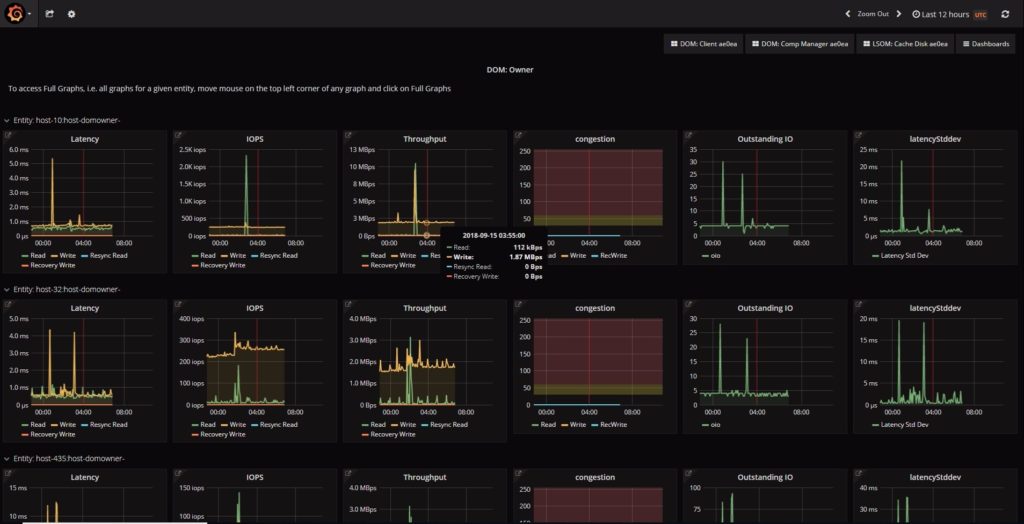
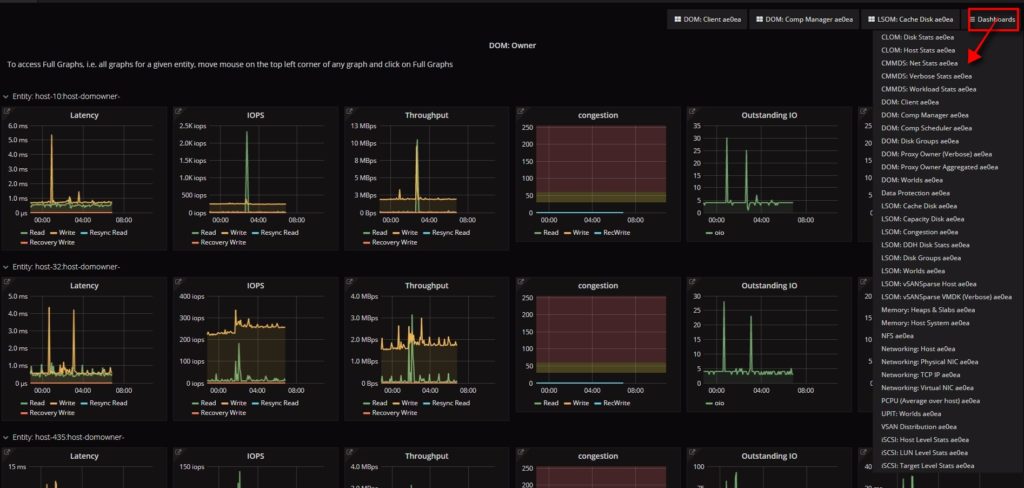
Finally the Performance Tab which is the most interesting feature , which uses the open source Grafana charts to show the perf data that was collected to VAC , which support can go back in time and investigate performance issues with help of different perf charts/parameters and custom time ranges.
Please note that you may share the Obfuscation map data which can be collected from health and performance tab to the support team for them to see the cluster, host and VM names as you see on the webclient .
I highly recommend to watch the official VMware vSAN support insight Demo- here :
http://https://www.youtube.com/watch?v=vrz0X07Rero
Conclusion
vSAN Support Insight is a great initiative from VMware from Customer experience perspective which brings in a lot of advantage towards resolving customer problems and also help improve features and stability of the product , its highly recommended to have the CEIP program enabled if not enabled . Also make sure to proactively share the VC-UUID/Cluster-UUID while filing a support ticket to help resolve issues sooner . Most of the customer have already enabled CEIP and are greatly benefited with vSAN Support Insight .


