
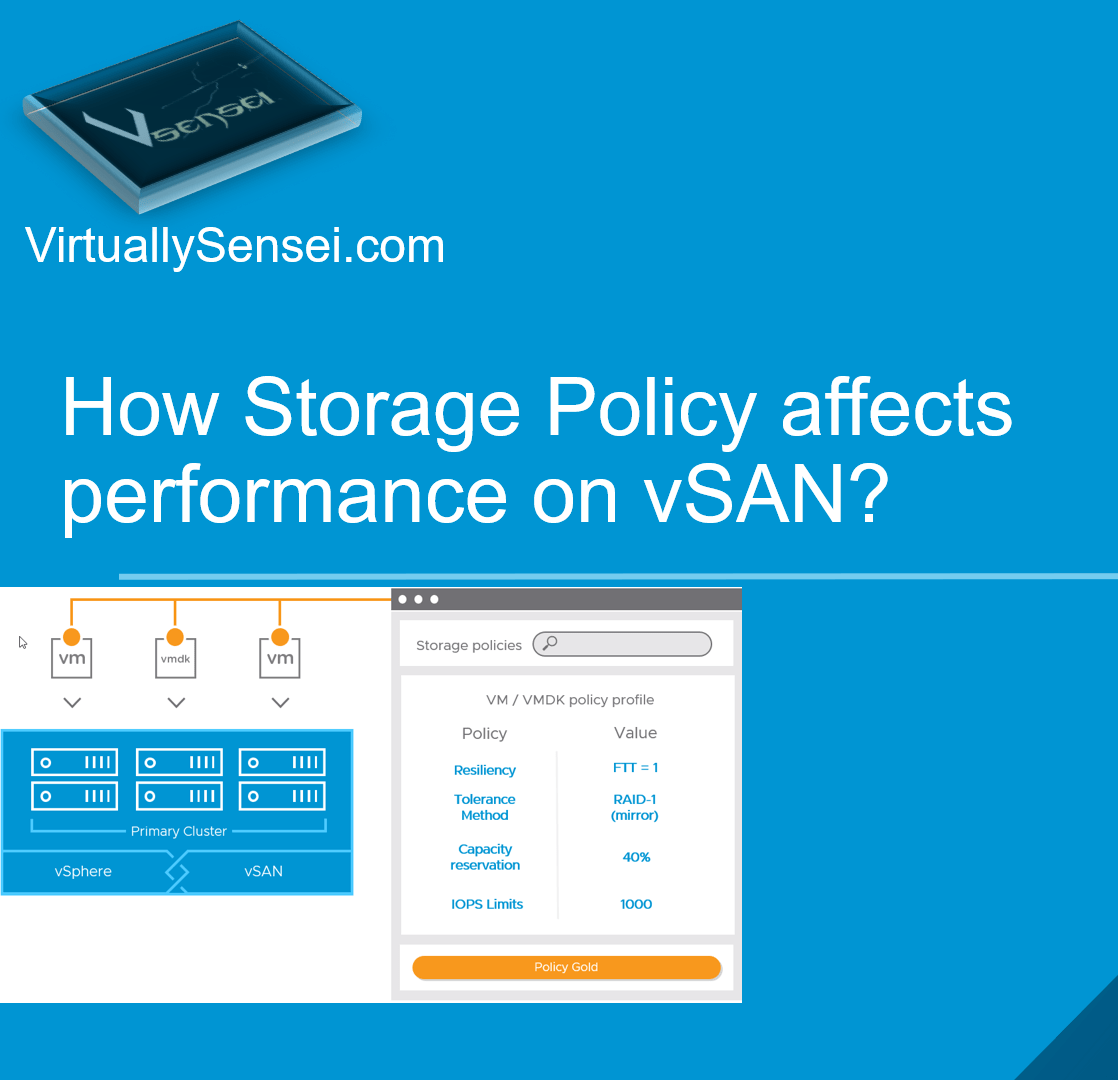
In this guide we will be looking at how we can use different storage policy on vSAN datastore to fine tune performance for the virtual machines running on a vSAN Datastore . We will look at different tools which can be run from the guest level and also few tests run with HCIBench .
Before you start reading thru this blog I highly encourage you to check out “Achieve-Best-Performance-on-vSAN” to get any understanding vSAN performance benchmark tool called HCIBench.
Please ensure to also go thru the post “understanding-vm-storage-policies” to get a hold of storage policy base management and different rule-sets / parameters within storage policy .
In this test case , I got my hands on one of a three Node Dell-Servers running vSAN 6.7 U1 All-FLASH with Dedupe and compression enabled , each host has 1 disk group with 1 SSD cache tier drive and two capacity tier drive and I ran two different BenchMarking tool “HCIBench” from VMware on this cluster and another in-guest level Disk Benchmark tool called “Crystal DiskMark” against individual VMDKs to compare performance with two different storage policy .
Hardware Specs
- server model and BIOS version
        Dell Inc. PowerEdge R630 | BIOS: 2.7.1

        #[Rackmount] [id:35865] DELL PowerEdge R630
        #vcgLink = 'https://www.vmware.com/resources/compatibility/detail.php?deviceCategory=server&productid=35865'
        #picture = 'https://www.google.com/search?q=DELL%20PowerEdge%20R630&source=lnms&tbm=isch&sa=X'
- CPU type
        Intel(R) Xeon(R) CPU E5-2630 v3 @ 2.40GHz
                # Link: 'http://www.google.com/#q=E5-2630+ark.intel.com'
        Number of packages (pCPU):2
        Number of cores (total):16
        Hyperthreading state: 3 -> enabled

- CPU microcode revision
        Current Revision:0x0000003d

- Network Interface Card
   2X - Intel Corporation Ethernet Controller 10 Gigabit X540-AT2


- Host Bus Adapter
   vmhba   driver   driver version                     model
   -----   ------   --------------                    ---------
   vmhba0  lsi_mr3  7.703.18.00-1OEM.650.0.0.4598673  Avago (LSI) PERC H730 Mini

- HBA queue settings
    PERC H730 Mini Integrated : 891

Controller HCL : https://www.vmware.com/resources/compatibility/detail.php?deviceCategory=vsanio&productid=34859

- Drives used for vSAN
esxcli storage core device list |grep -i 'Devfs Path\|vendor\|Model\|Revision\|Raid\|size' | egrep -v Queue |sed 'N;N;N;N;N;s/\n//g'

   Size: 190782   Devfs Path: /vmfs/devices/disks/naa.55cd2e414d9b2945  Model: INTEL SSDSC2BA20   Revision: DL2B   RAID Level: NA
   Size: 915715   Devfs Path: /vmfs/devices/disks/naa.5002538c4044d6ab  Model: MZ7KM960HAHP00D3   Revision: GB52   RAID Level: NA
   Size: 915715   Devfs Path: /vmfs/devices/disks/naa.5002538c4044d6ad  Model: MZ7KM960HAHP00D3   Revision: GB52   RAID Level: NA
Cache Tier HCL    : https://www.vmware.com/resources/compatibility/detail.php?deviceCategory=ssd&productid=39831 - "CLASS-E  30,000-100,000 writes per second"
Capacity Tier HCL : https://www.vmware.com/resources/compatibility/detail.php?deviceCategory=ssd&productid=39915 -  "CLASS D: 20,000-30,000 writes per second"
RUN-HCIBench
From the above specs its clear that we can only define the storage policy with fault tolerance method as RAID-1 with stripe width either as SW=1 or SW=2 going higher stripe width is point less as we only have two capacity tier drives and one Disk group . Hence I did run different tests with SW=1 and SW=2 . Here are the result comparison .
Note: The following illustrations is used only to show difference between two storage policy , do not use them as expected benchmark results in your environment as these results are purely environment dependent .
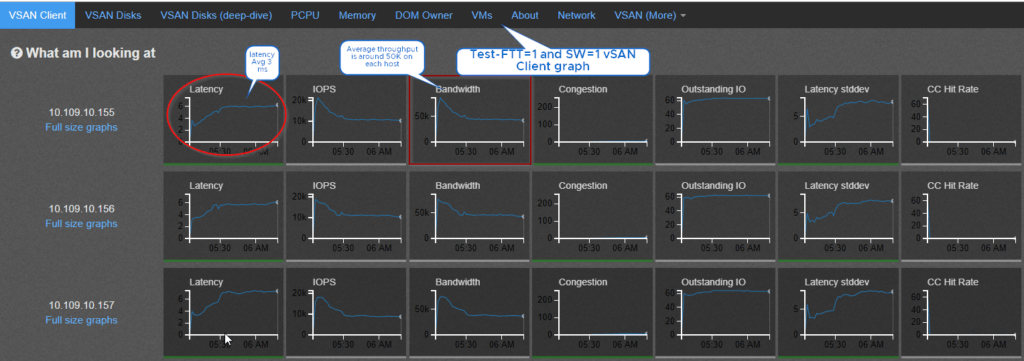
1) Test result on Storage Policy Definition as failures to tolerate -1 and stripe-width=1 gives with the workload definition “6 VMs, 8-vDisks, 80% working set , 4K Block Size, 70% read% and 80% random packets , number of threads as 4” is 31111 IOPS and throughput of 121MB/s .
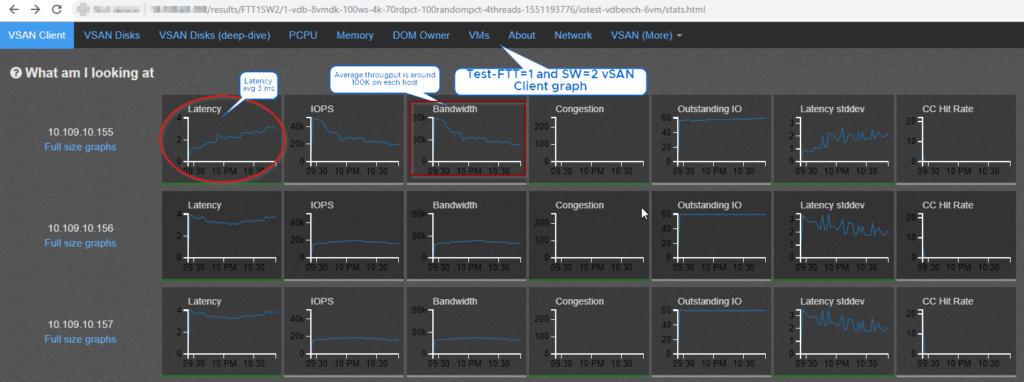
2) The same workload was next run with Storage Policy Definition as failures to tolerate -1 and stripe-width=2 , we see that this policy was able deliver 59017 IOPS and throughput of 230MB/s this is almost two times the IOPS and throughput achieved previously by only increasing the stripe width from one to two .
Please click thru the following Images to see test results :

Running Guest Level BenchMark!
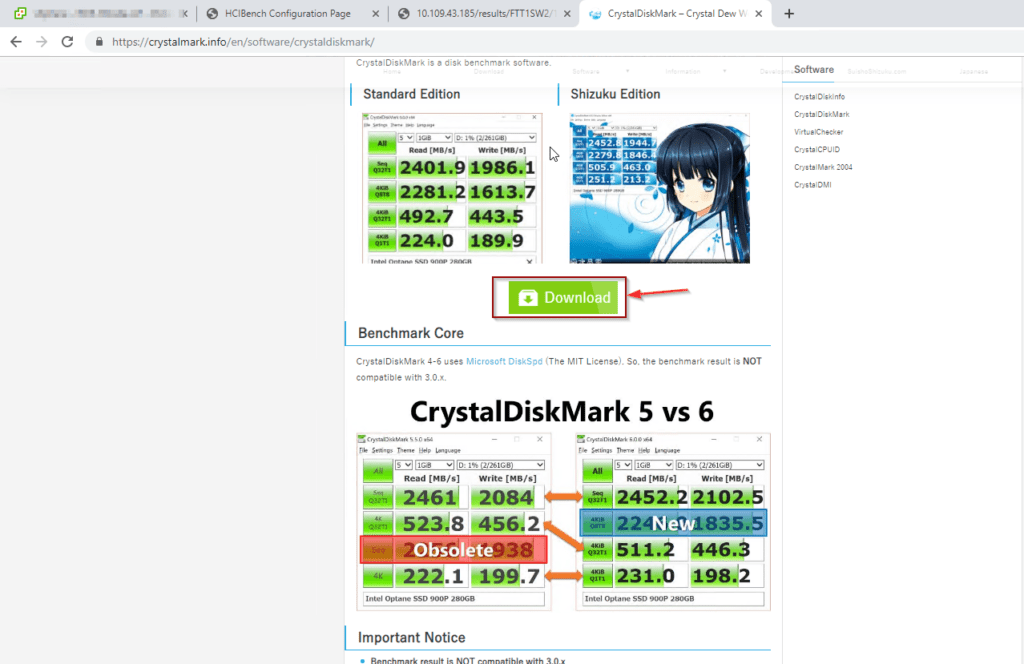
To validate if we are actually benefited from higher stripe width , we may also run some guest level performance benchmark tests . For this test I chose to use/run Crystal-DiskMark Utility , there are many tools available in the market depending on the type of Guest-OS .
I picked up one of a windows server-2k16 VM , presented two new hard-disks of size 2GB each , applied the vSAN-Default-Storage-Policy on the first vmdk which is nothing but FTT=1 ,SW=1 and FTT=1 ,SW=2 storage policy is applied on the second disk. Next I ran similar workload test on both these drives , it is clearly evident that the writes are always benefited when the components are striped across multiple capacity tier SSD drives .


Running Crystal Diskmark against two drives!
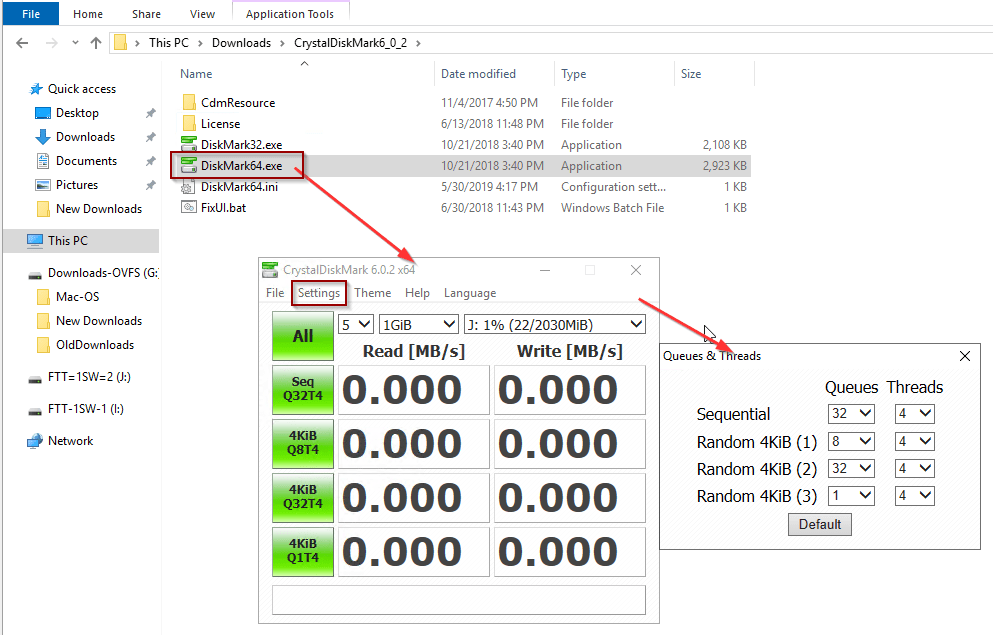
- Download and extract “CrystalDiskMark6_0_2.zip” , run the 64bit file
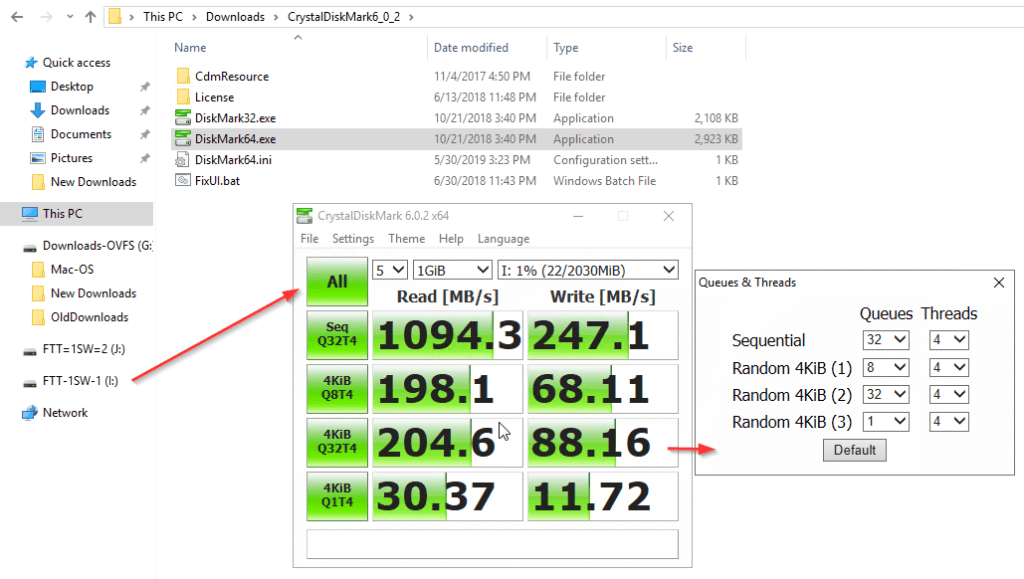
- Configure Test Settings (queue and threads)and run the benchmark tool against the first drive with SPBM FTT=1 and SW=1
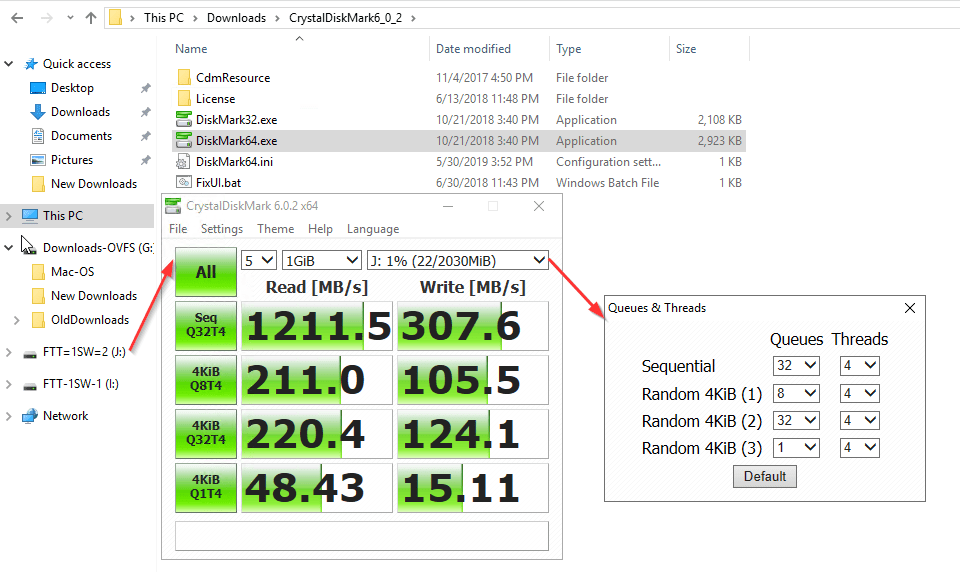
- Run the same benchmark test against the second drive which use SPBM FTT=1 and SW=2
From the above tests we see that the J:Drive which is with higher stripe width defined on the storage policy yields higher throughput especially in terms of writes which might be critical for most of the applications which are I/O intensive , also read is benefited since the reads are also served by two different capacity tier drive directly to the VMs (Only in All-Flash).
It is always recommended to run HCIBench and Guest level bench mark tests with different tool which can generate a very close/similar workload to that of real life application and find the sweet-spot (right storage policy) which yields best performance for the specific use case.
NOTE: A storage policy which is best suited for Application-A will not be the best storage policy for Application-B , its always recommended to run different tests of each application to find the correct storage policy . At times there will be contention at the virtual disk level because of the type of virtual storage controller like LSI-LOGIC , you might want to use PV-SCSI controller to get higher queue depth upto 256 for heavy VMS , see KB : https://kb.vmware.com/s/article/2053145 .
If you enjoyed this post, I’d be very grateful if you’d help it spread by emailing it to a friend, or sharing it on Twitter or Facebook. Thank you!