

Here is a detailed guide on how we may approach ways to optimize a vSAN cluster to deliver best performance on a cluster and find your answers to your questions.
How do we assess vSAN performance ?
What can I expect from a specific hardware?
How best can we tweak vSAN clusters to achieve best performance ?
What are the tools which we can use to use to benchmark vSAN performance ?
I highly encourage you to go thru the guide for Deployment Guide for HCIBench before you read this blog about running HCIBench Tests .
I would like to write this guide in three sections .
- Pre-requisite for the vSAN cluster before performing an sorts of benchmark tests and methodology
- How to use HCIBench test with different parameter files to find the sweet-spot.
- Result comparison between different tests and choosing an optimal SPBM and workload set .
Pre-Requisites
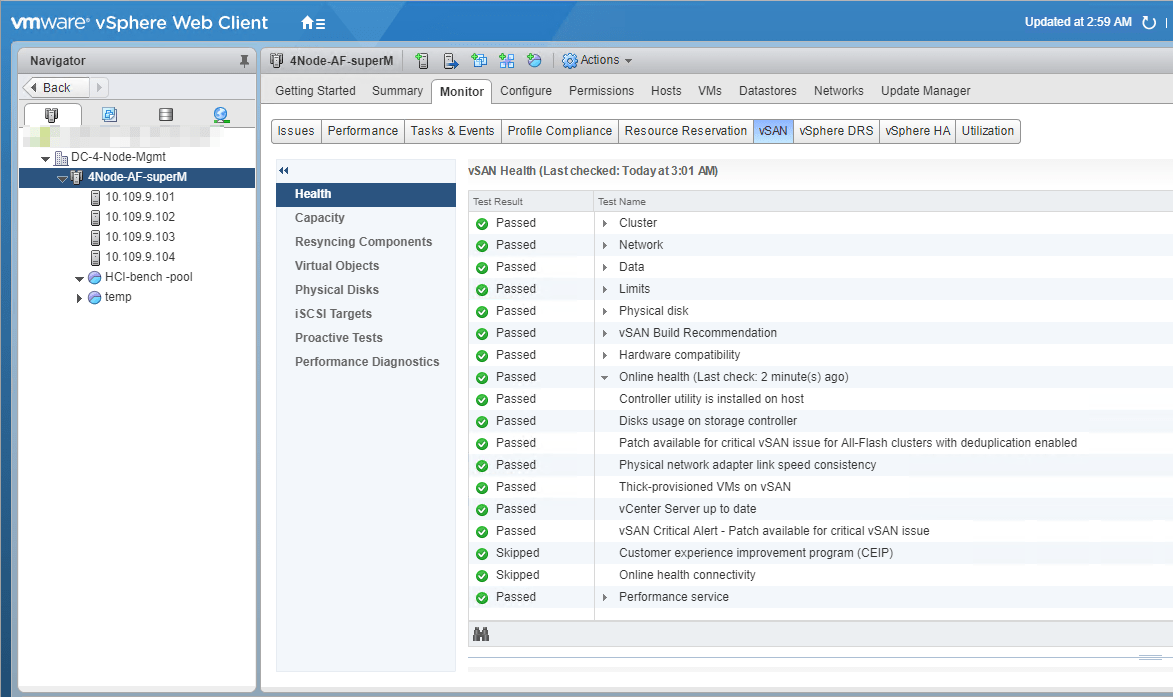
- All-Green vSAN Configuration Health Checks
Please make sure that we are not seeing any sorts of health check failures under Cluster Monitor vSAN Health , this will avoid any sort of deviation due to H/W compatibility , driver& firmware for controllers/disks , unsupported controllers etc .

- Never run Performance bench marking application when the cluster is already in production , This means that if there were running production vms in the cluster and if you start any benchmarking tests , this will lead to performance issues with the production VMs . Also the test results will not be accurate since cluster was already loaded with production VMs . If you would like to still run HCIBench on a production cluster , its recommended to power down all the VMs over maintenance window and then run HCIBench to get near accurate results .
Note* : Make sure write-buffer free % is greater than 90% before you run a test .
Methodology
To achieve a satisfactory vSAN performance results , one must be aware of what kind of applications this cluster is expected to run , the type of drives used and have a reasonable expectations which will result in a satisfactory result .

Please understand that the results what we see with any benchmarking tool (Synthetic workload) may not be the same results when we run the real life workload , the results may vary . These parameters and workloads defined on the tools we use may be completely different with your real life application . Hence its recommended to use the right tool , though HCIBench tool is the good way to start to get initial benchmark numbers on the cluster .
Download and Run vSAN HCIBench
Please read thru the complete guide to download and deploy HCIBench here where I have discussed the reason why we should choose use HCIBench to run performance benchmarking on vSAN datastore and how do we download and deploy .
Once the HCIBench is deployed we will need to run different test by changing parameters, perform tweaks to achieve best performance . We will see what are the test we can run within HCIBench to find the perfect sweet-spot to get best performance on a cluster.

Recommended Workflow for HCIBench

The workflow which I usually follow is to run the easy-run on the HCIBench first , get the results use that as a reference number and then start playing around with the parameters , storage policy and run different test using the same VMs which was previous deployed by the easyrun bench mark test to reduce waste of time redploying the VMs all over again , compare the results change up the parameters again until we can find a satisfactory number or the sweet spot which gives us best numbers .
Running HCIBench on a 4Node-All-Flash Cluster
I just got my hands on a 4-Node-All-Flash supermicro cluster which I will be using the HCIBench to find the sweetspot to get the performance bench result .
Hardware Configuration
** Recommended to copy below content to a Notepad for aligned text**
- server model and BIOS version
	Supermicro SYS-2028TP-HC0TR | BIOS: 2.0
- WebHCL compatibility check
vcgLink = 'https://www.vmware.com/resources/compatibility/detail.php?deviceCategory=server&productid=41008'
picture = 'https://www.google.com/search?q=Supermicro%20Computer%20Inc%20SYS-2028TP-HC0TR&source=lnms&tbm=isch&sa=X'

- CPU type
	Intel(R) Xeon(R) CPU E5-2650 v3 @ 2.30GHz
		# Link: 'http://www.google.com/#q=E5-2650+ark.intel.com'
	Number of packages (pCPU):2
	Number of cores (total):20
	Hyperthreading state: 3 -> enabled

- CPU microcode revision :
  Current Revision:0x0000003d

- Network Interface Card
   2X 10-Gigabit SFI/SFP+ Network Connection (Used for vSAN)


- Host Bus Adapter
   lsi_msgpt3   Avago (LSI Logic)  Fusion-MPT 12GSAS SAS3008 PCI-Express


SSD-Drive details from SSH :

[root@esxi03:~] esxcli storage core device list |grep -i 'Devfs Path\|vendor\|Model\|Revision\|Raid\|size' | egrep -v Queue |sed 'N;N;N;N;N;s/\n//g'
   Size: 763097   Devfs Path: /vmfs/devices/disks/naa.55cd2e404c211107 Model: INTEL SSDSC2BB80   Revision: 0140
   Size: 763097   Devfs Path: /vmfs/devices/disks/naa.55cd2e404c211073 Model: INTEL SSDSC2BB80   Revision: 0140
   Size: 763097   Devfs Path: /vmfs/devices/disks/naa.55cd2e404c212d55   Vendor: ATA        Model: INTEL SSDSC2BB80
   Size: 190782   Devfs Path: /vmfs/devices/disks/naa.55cd2e404c20d56d   Vendor: ATA        Model: INTEL SSDSC2BX20
   Size: 763097   Devfs Path: /vmfs/devices/disks/naa.55cd2e404c2114c4   Vendor: ATA        Model: INTEL SSDSC2BB80
   Size: 763097   Devfs Path: /vmfs/devices/disks/naa.55cd2e404c212a02   Vendor: ATA        Model: INTEL SSDSC2BB80

Cache Tier VCG Link :https://www.vmware.com/resources/compatibility/detail.php?deviceCategory=ssd&productid=40328 - Performance Class:	Class C: 10,000-20,000 writes per second
Capacity Tier VCG Link : https://www.vmware.com/resources/compatibility/detail.php?deviceCategory=ssd&productid=40540 - Performance Class:	Class C: 10,000-20,000 writes per second

DG layout :

[root@esxi03:~] vdq -i
[
   {
      "SSD" : "naa.55cd2e404c20d56d",
       "MD" : [
              "naa.55cd2e404c211107",
              "naa.55cd2e404c211073",
              "naa.55cd2e404c212d55",
              "naa.55cd2e404c2114c4",
              "naa.55cd2e404c212a02",
              ]
   },
]
Easy-Run Test and Results :
- Setup the configuration page , perform a validation test .
Here in this test I have used the vSAN default storage policy and the cluster has dedup and compression enabled .


- Run Test and Review results
I was able to run different tests with this cluster and found that the RAID-5 Performance was pretty decent when compared to RAID-1 considering the fact that the data components was placed across all four hosts when compared to the fact that RAID-1 will mostly pick two hosts to place the data components . You may Download the Results for offline view .
Based on the test results : we see that the test which was run with 8 vmdks with 4gb capacity tier drive with 70% read , 100% random packets, 100% working set is a common test which was run with various storage policies . Below is what we understand from the test results .
- Raid-5 , FTT-1,SW-1- 8vmdk-100ws-4k-70rdpct-100randompct-4threads gave us the best performance among all the test which was run in this environment , in fact I had this run two times to see if the results are consistent .
- Raid-1 , FTT-1,SW-4 – 8vmdk-100ws-4k-70rdpct-100randompct-4threads ranks seconds for the best performance , however I expected this result to be better than the Raid-5 Sw-1 test . May be changing the size of the vmdk would give us different test results .
- Raid-5 , FTT-1,SW-4 , comes next with the same working set , however I expected this test to give more IOPS/Throughput when compared to Raid-5 , FTT-1,SW-1
What do we understand from graphs ?
Here I just picked up one of the test results to explain what we can understand for the test Raid-1 , FTT-1,SW-4 – 8vmdk-100ws-4k-70rdpct-100randompct-4threads-stats.html file which display graphical information which was collected by observer data within the HCIBench VM .
- vSAN Client – This graphs displays the throughput and latency values seen at client side which is from Virtual machine perspective .
 we see that the latency value is consistent and less than 4ms across all the hosts . We see that the IOPS,Throughput(Bandwidth) and latency is slightly higher on host-10.109.10.104
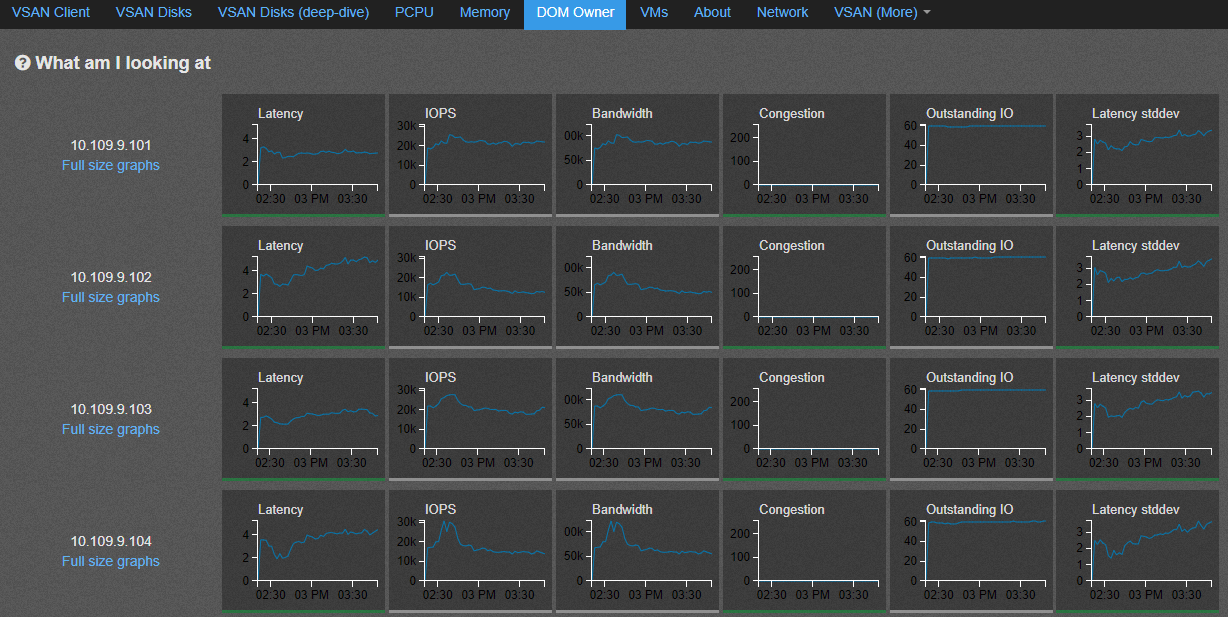
 - DOM-Owner – This graphs displays the throughput and latency values seen at layer just before IO traverses thru vSAN back-end file-system which is the object-owner level latency .

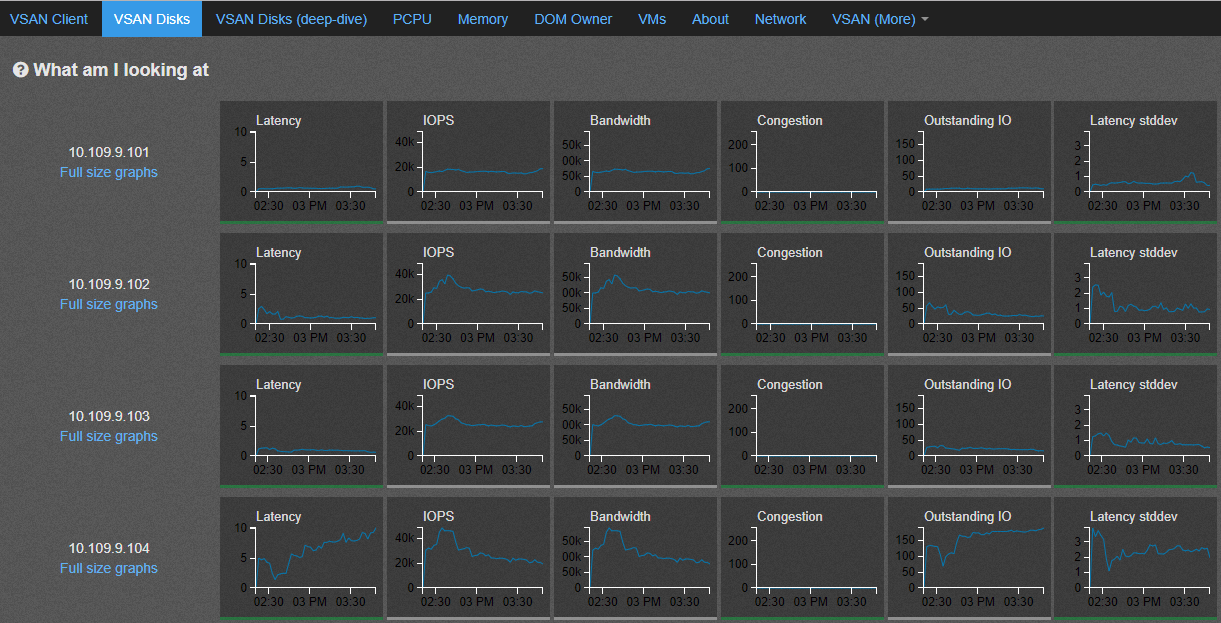
The above graphs values are almost similar to what we see at the vSAN-client level . - vSAN-Disks – This graphs displays the throughput and latency values seen at the beginning of vSAN-backend layer called DOM-Component Manager

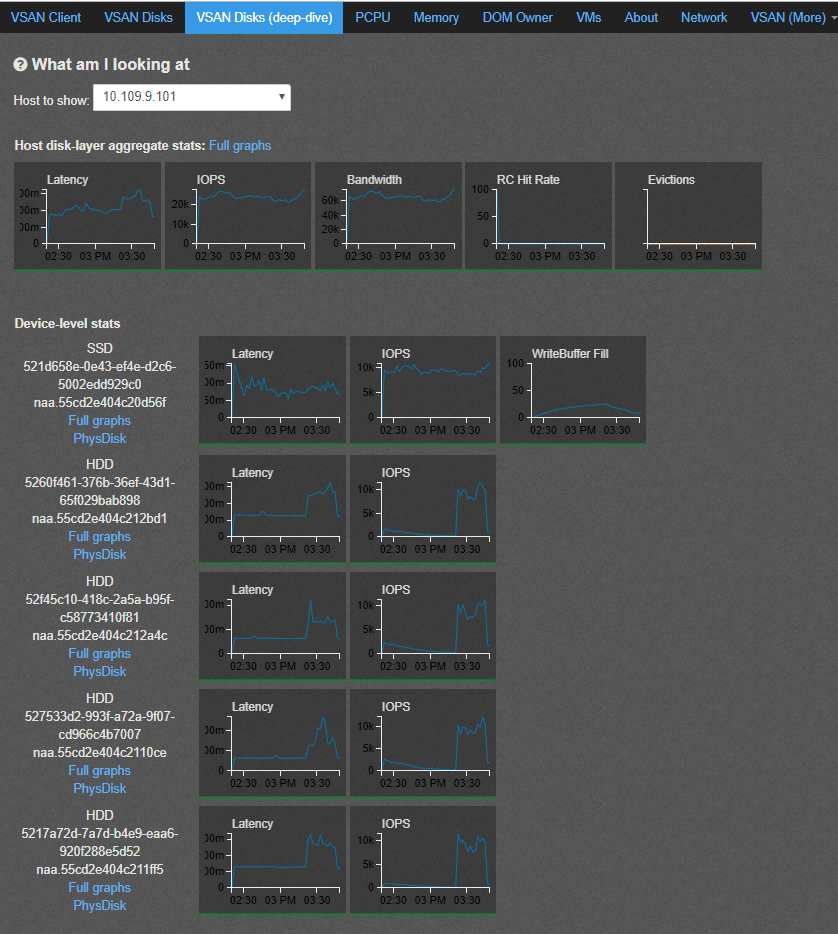
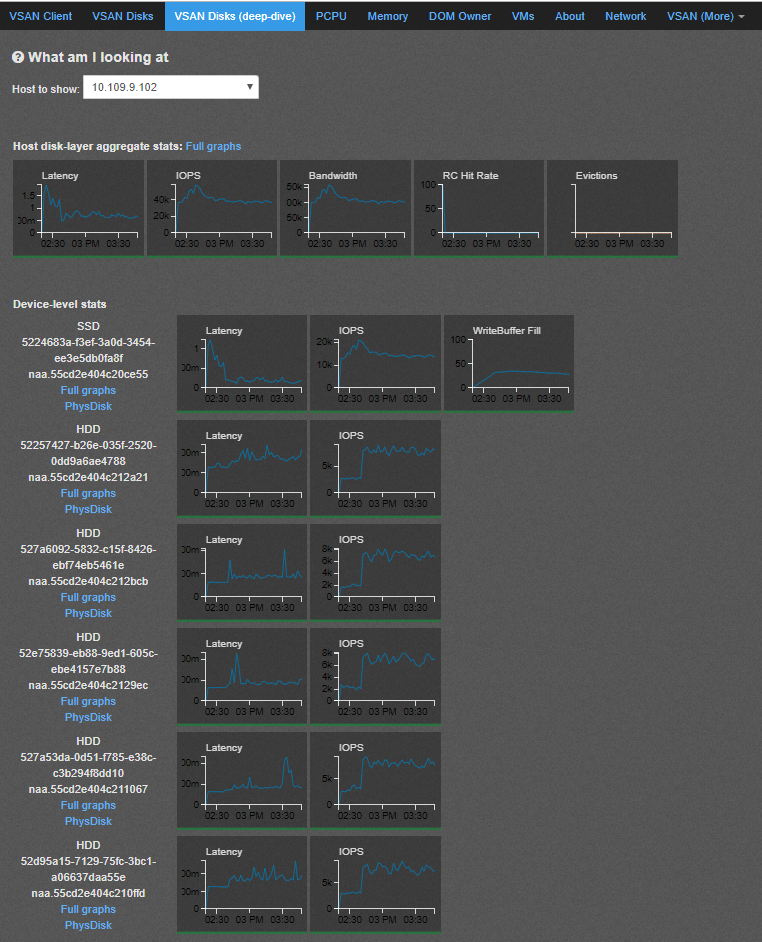
From the above graphs we see that the number of IOPS and Throughput dropped over the period of the during the test and the outstanding number of IOPS were also spiking up on the host – 10.109.10.104 . This will need further investigation . - vSAN-Disks(DeepDive)- Shows the graphs from individual hosts against the devices which participating in the vSAN cluster on respective hosts .


 From the above graphs and comparison between the results from all four hosts . The physical Drive latency values are all less than 200 microseconds . we see that for the host-04 was seeing IOPS greater than 60k while other hosts had less than 40K . We also see that the write buffer consumption on the Cache-SSD drive was close to 70% towards the end of the test while others stayed within 50% . We also see that the SSD started to elevate the data from Cache to Capacity drive soon after we cross 30% write buffer consumption .


- From section vSAN-More and congestion , we see that the Log congestion against host-04 was very high , this log congestion might be due to the fact that the number of IOPS against host-04 was very high and the write logs from above graphs was constantly increasing , hence the host had to build up log congestion to get some time to elevate the data from write buffer down to capacity tier drive .


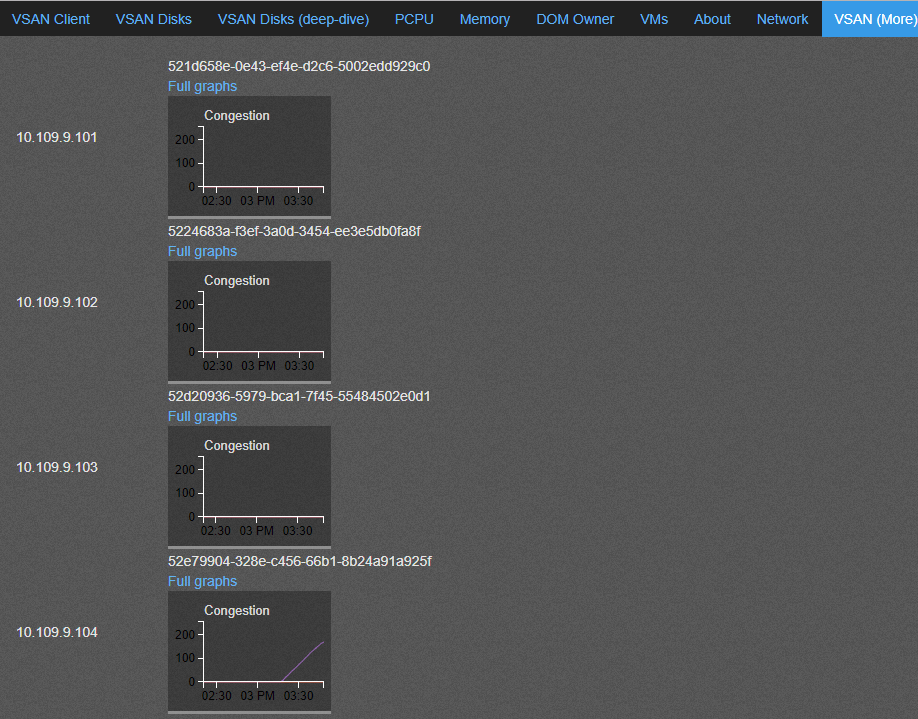

Conclusion :
From all the above graphs we can conclude that the IOPS/Throughput which started to drop at the vSAN-Client layer on host-04 was because of the fact that the SSD drive started to build Write-Log congestion as high as 180 , due to fast write buffer fill up . It is possible that the VD-bench VMs which were running on this host generated very high IOPS when compared to other hosts , or the write buffer was not cleared before the test was started .
Note*: The test result which we saw with various tests thru HCIBench are with synthetic test workload , the parameters may vary with real life applications / workload . It is recommended you run different test from within the guest VM which can generate workload similar to that of production application .
I can discuss a few guest level benchmarking tools in my next Blog . I hope you found this useful .

